Instruments UI provides a way to:
- Add a new instrument in Gaia
- Edit an existing instrument details
- View Instrument Dashboard
Navigation to the Instruments Page
- Go to the Left Navigation Menu
- Click on the menu item called Instruments
- The Instruments page will be displayed
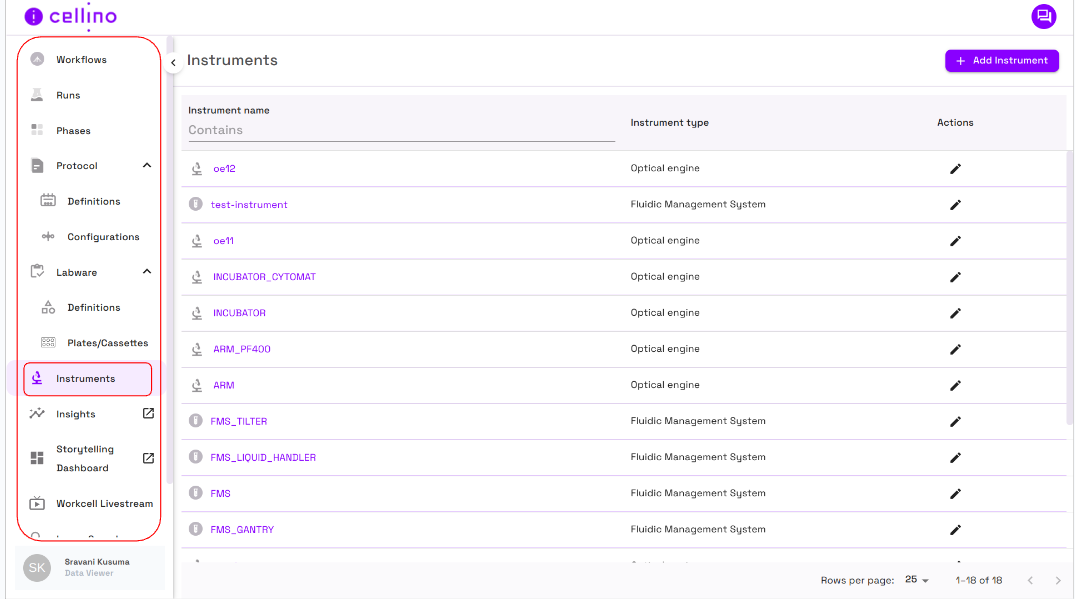
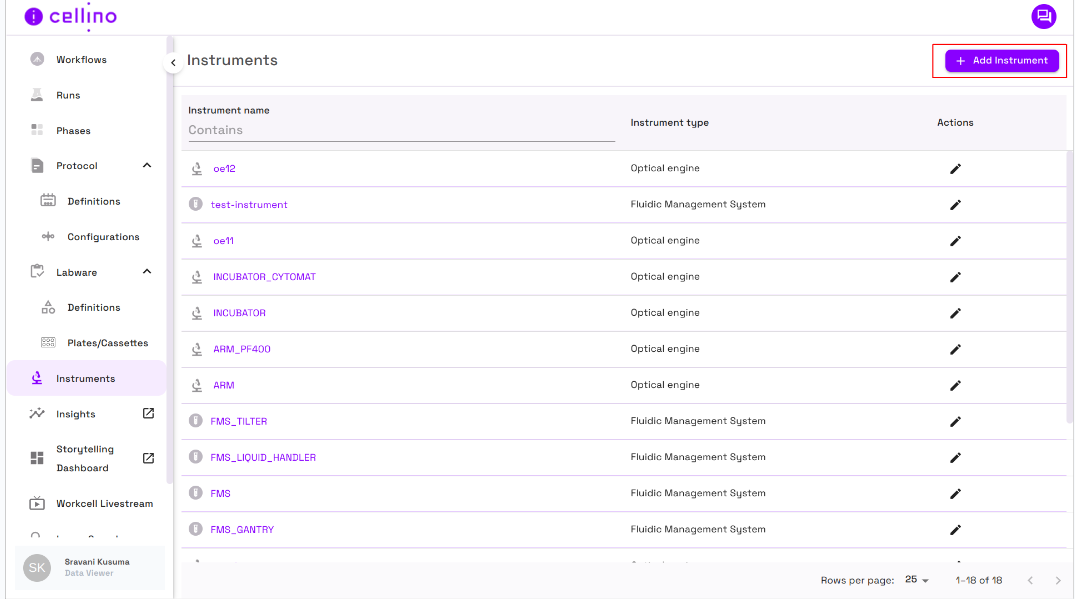
The Instruments Page Displays
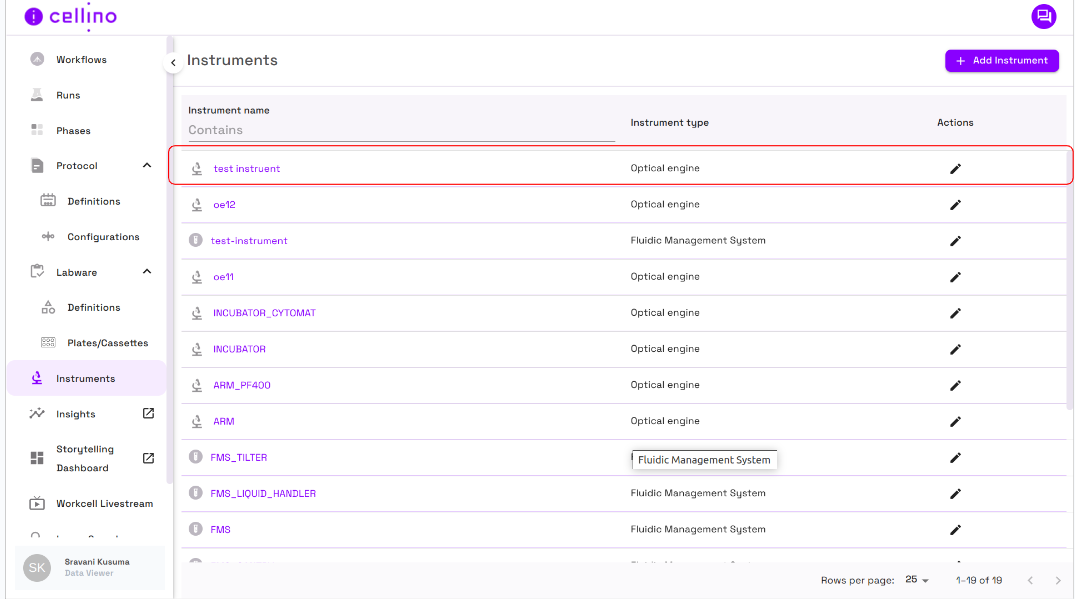
- Page title and an action button at the top of the page to create a new instrument.
- A table of available instruments that consists of the following columns:
- Instrument Name: Displays the name of the instrument..
- Instrument type: Displays the type of the instrument.
- Actions: Provides the ability to edit an existing instrument.
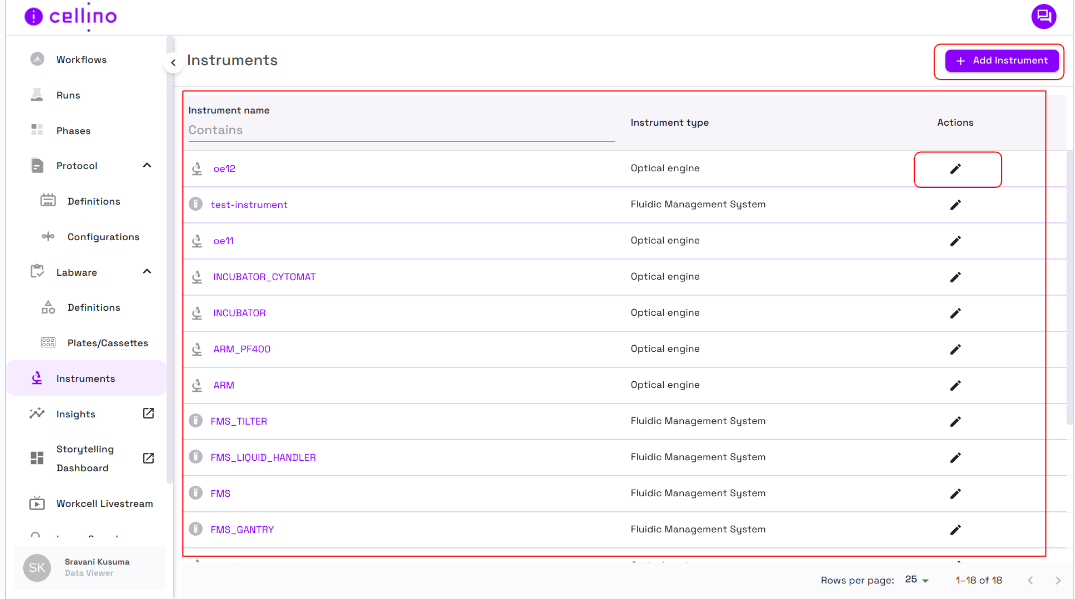
Filtering instruments
- Users can search specific fields by entering keywords, ensuring relevant results are displayed.
- Users can search for a specific instrument by filtering in Instrument name column.
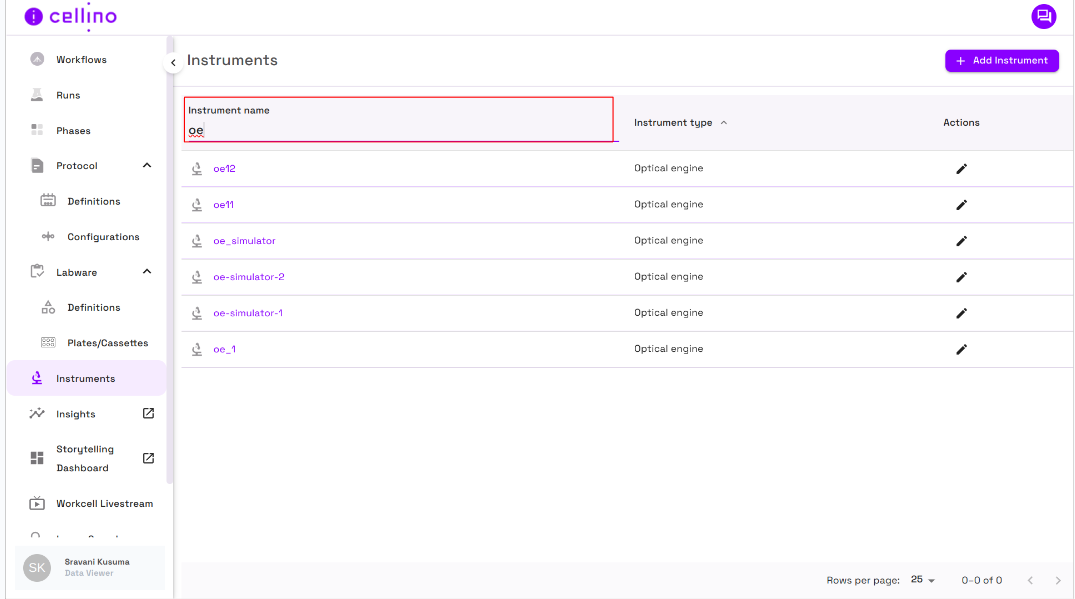
Instrument Dashboard
-
To navigate to the instrument dashboard click on the instrument name in the table which will redirect to the dashboard
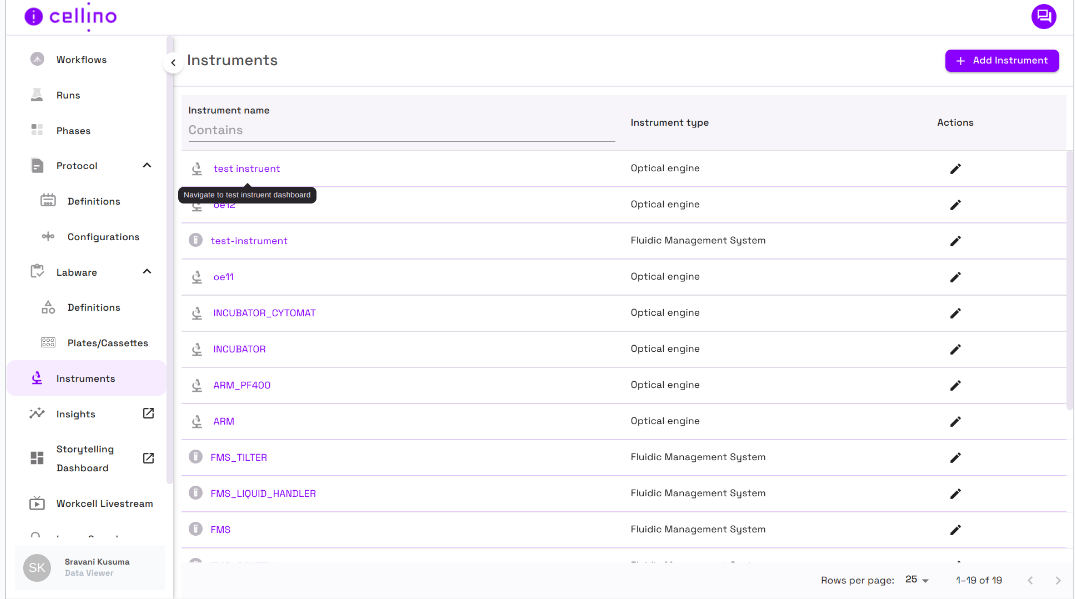
-
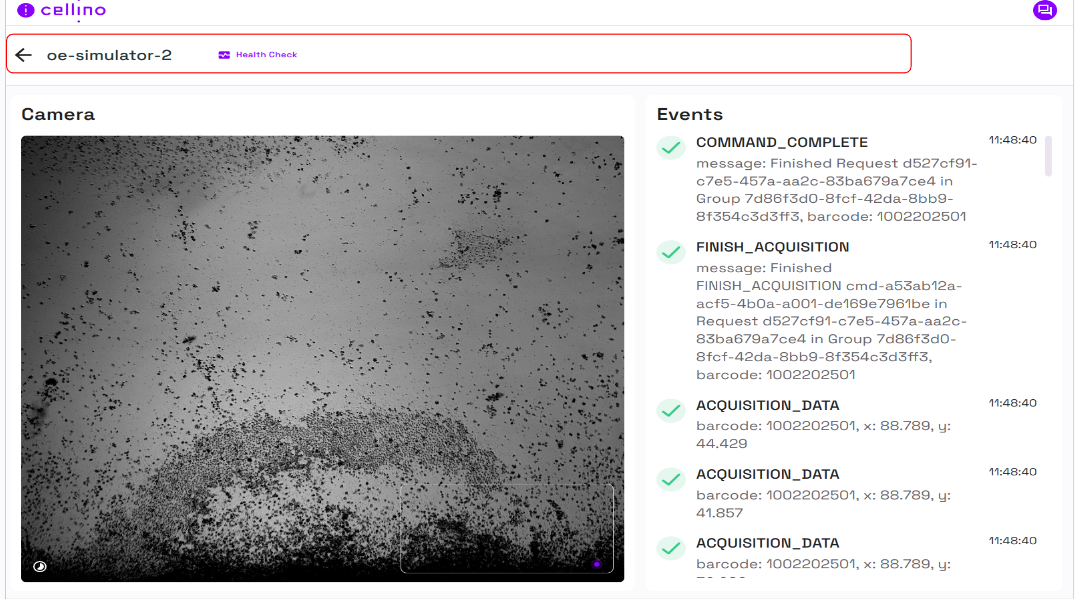
Optical Engine Dashboard
- This dashboard is designed to monitor and track the real-time operations of an optical instrument.
- It provides a imaging feed, a minimap for position tracking, and a real-time event log that records important actions and data points.
- The top section has a navigation bar with the instrument name and a Health Check indicator, to show the status of the instrument.
-
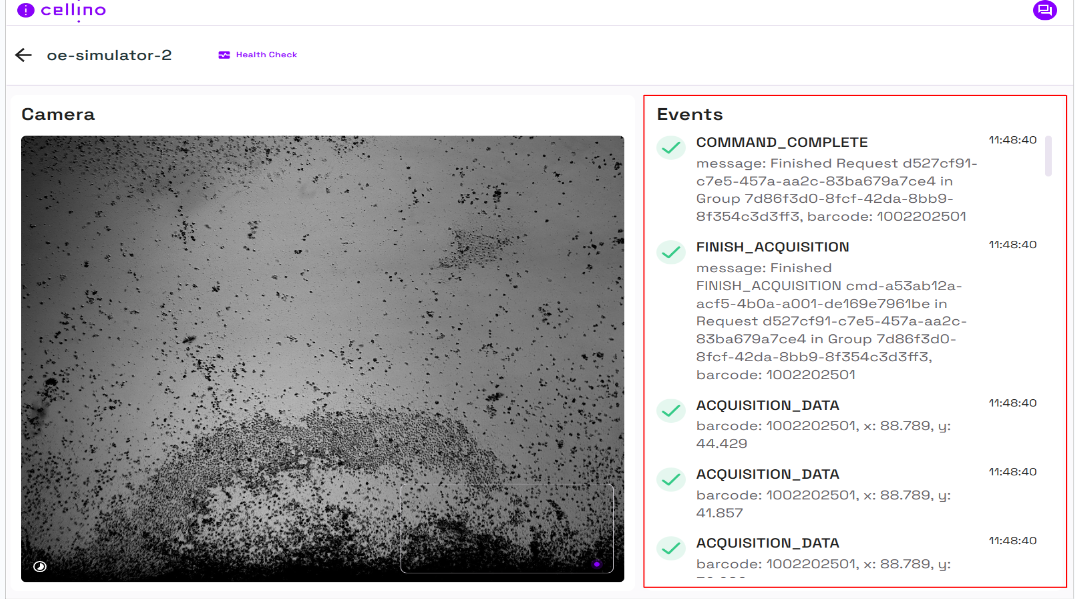
Event Stream
- Shows real-time system events, each accompanied by a timestamp.
- Events show additional metadata like barcode, x and y coordinates of the image.
-
Camera Stream
- The large grayscale image represents the real-time imaging feed from the instrument.
- On the image, at bottom left there is a timelapse icon which on hover shows how many seconds ago the image was captured.
- As the instrument is capturing data continuously, which is reflected in the event logs
-
Minimap View
- A small, outlined rectangle with a purple dot inside represents the MiniMap.
- This indicates the current position within the full imaging field.
- The purple dot represents the exact area being processed.
- This helps users track which part of the sample is currently being analyzed.

-
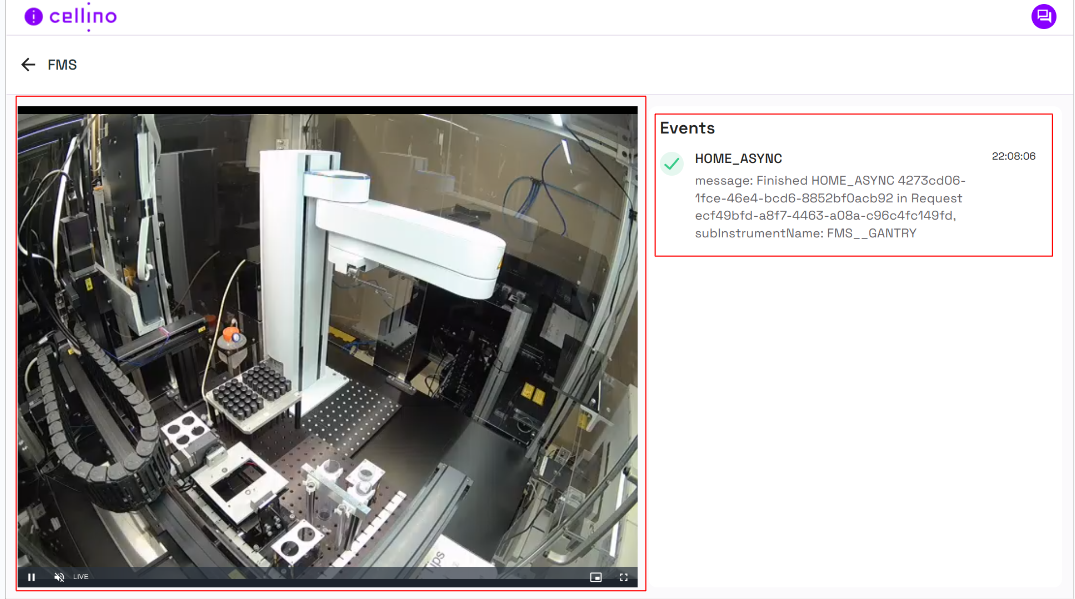
FMS Dashboard
- FMS dashboard page consists of the name of the instrument at the top of the page
-
Event Stream
- real-time system events, each accompanied by a timestamp.
- Events show additional metadata like message, subInstrumentName.
-
FMS Camera
- Nebula workcell camera shows the live activity happening in the lab like moving the instrument, tip attaching,...
-
Creating an instrument
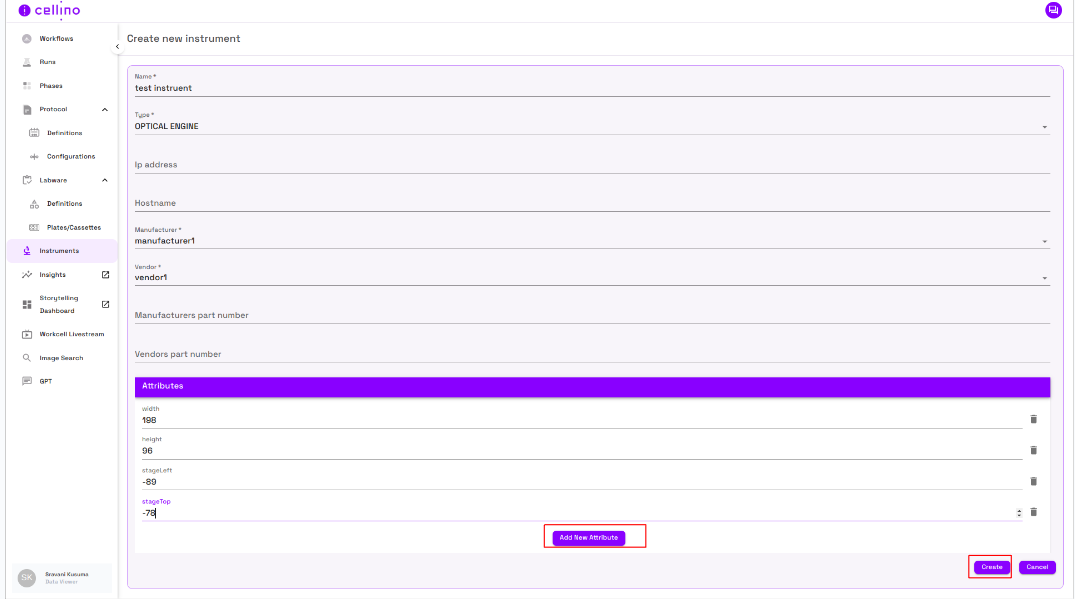
- To create a new instrument, click the Add Instrument button in the top right corner of the page.
- Fill out the required fields
- Name
- Type
- Manufacturer
- Vendor
- Add necessary attributes depending on the type of the instrument using the add new attribute button.
- For Optical engine instrument these attributes are mandatory width, height, stageLeft, stageTop
- For FMS instrument we have an attribute called cctvChannelNumber to stream the camera feed in the dashboard.
- Once all the fields, click Create.
- The instrument will be created and we will be redirected to the instruments page.
Edit existing instrument
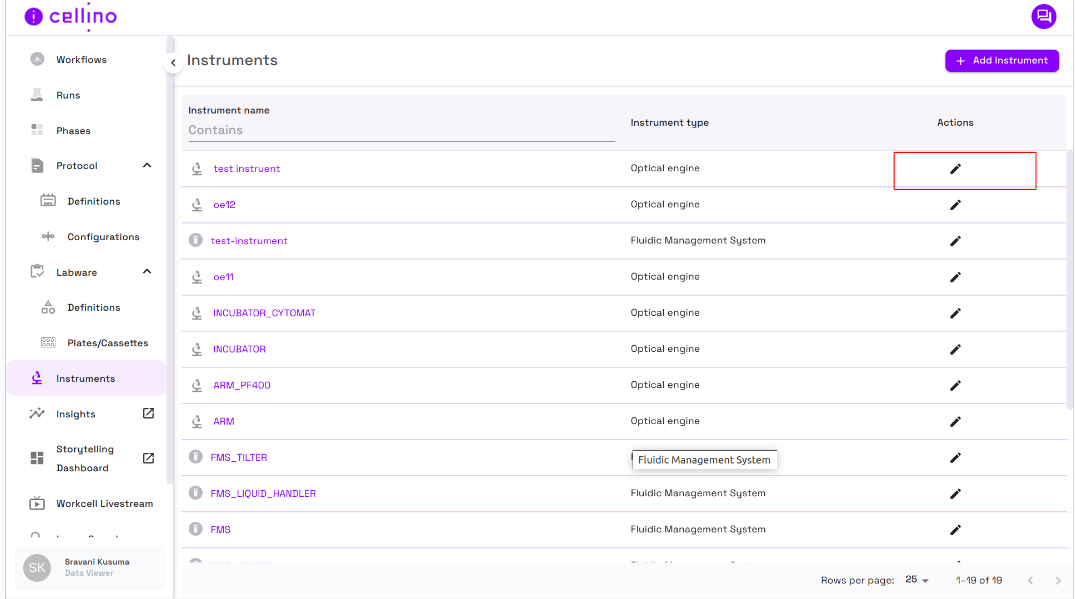
- Click on the edit icon in the actions column corresponding to the instrument we want to edit.
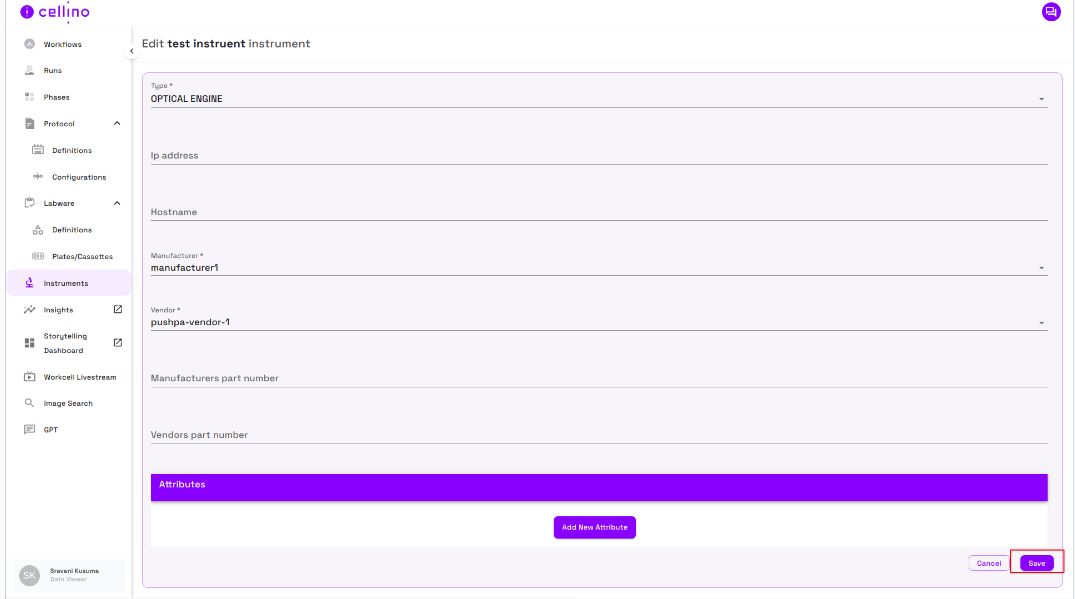
- The edit instrument page should be displayed with prefilled existing details of the instrument.
- Users can modify the necessary changes in the editable fields.
- Once the modifications are made click Save button to apply changes.
- After saving the changes are reflected and the user will be redirected back to the instruments page.

Video Instructions
For detailed video instructions, refer to the following link: